GEOL 492/692 Seminar: Data Visualization
Earthquakes and Volcanoes Dashboards
In the Spring of 2024 we are exploring storytelling with data through interactive visualizations (dashboards). Our first project was to learn about publically available datasets for Earthquakes, Volcanoes, Plate Tecontic Boundaries, and World Faults. The tasks were broken into stages:
- Download data from the different sources and load into Tableau
- Build basic visualizations to explore the data. Visualizations inclue: histograms, cross-plots, time-series, maps, among others
- Collectively ask questions about the data and build hypotheses
- Design dashboards to address interrogate the dataset to answer questions
We used the following datasets:
- Earthquakes: https://www.usgs.gov/programs/earthquake-hazards/earthquakes
- Plate Tectonic Boundaries: https://hub.arcgis.com/datasets/5f01bc7f78d74498aa942455fcd0dc10/explore
- World Volcanoes: https://www.ngdc.noaa.gov/hazel/view/hazards/volcano/event-search
- Bathymetry Data: https://wms.gebco.net/mapserv?
- US Faults: https://www.usgs.gov/programs/earthquake-hazards/faults
- Global Active Faults: https://github.com/cossatot/gem-global-active-faults/tree/master
Example student projects:
Logan Seymour (Senior, Geology-Geophysics Concentration)
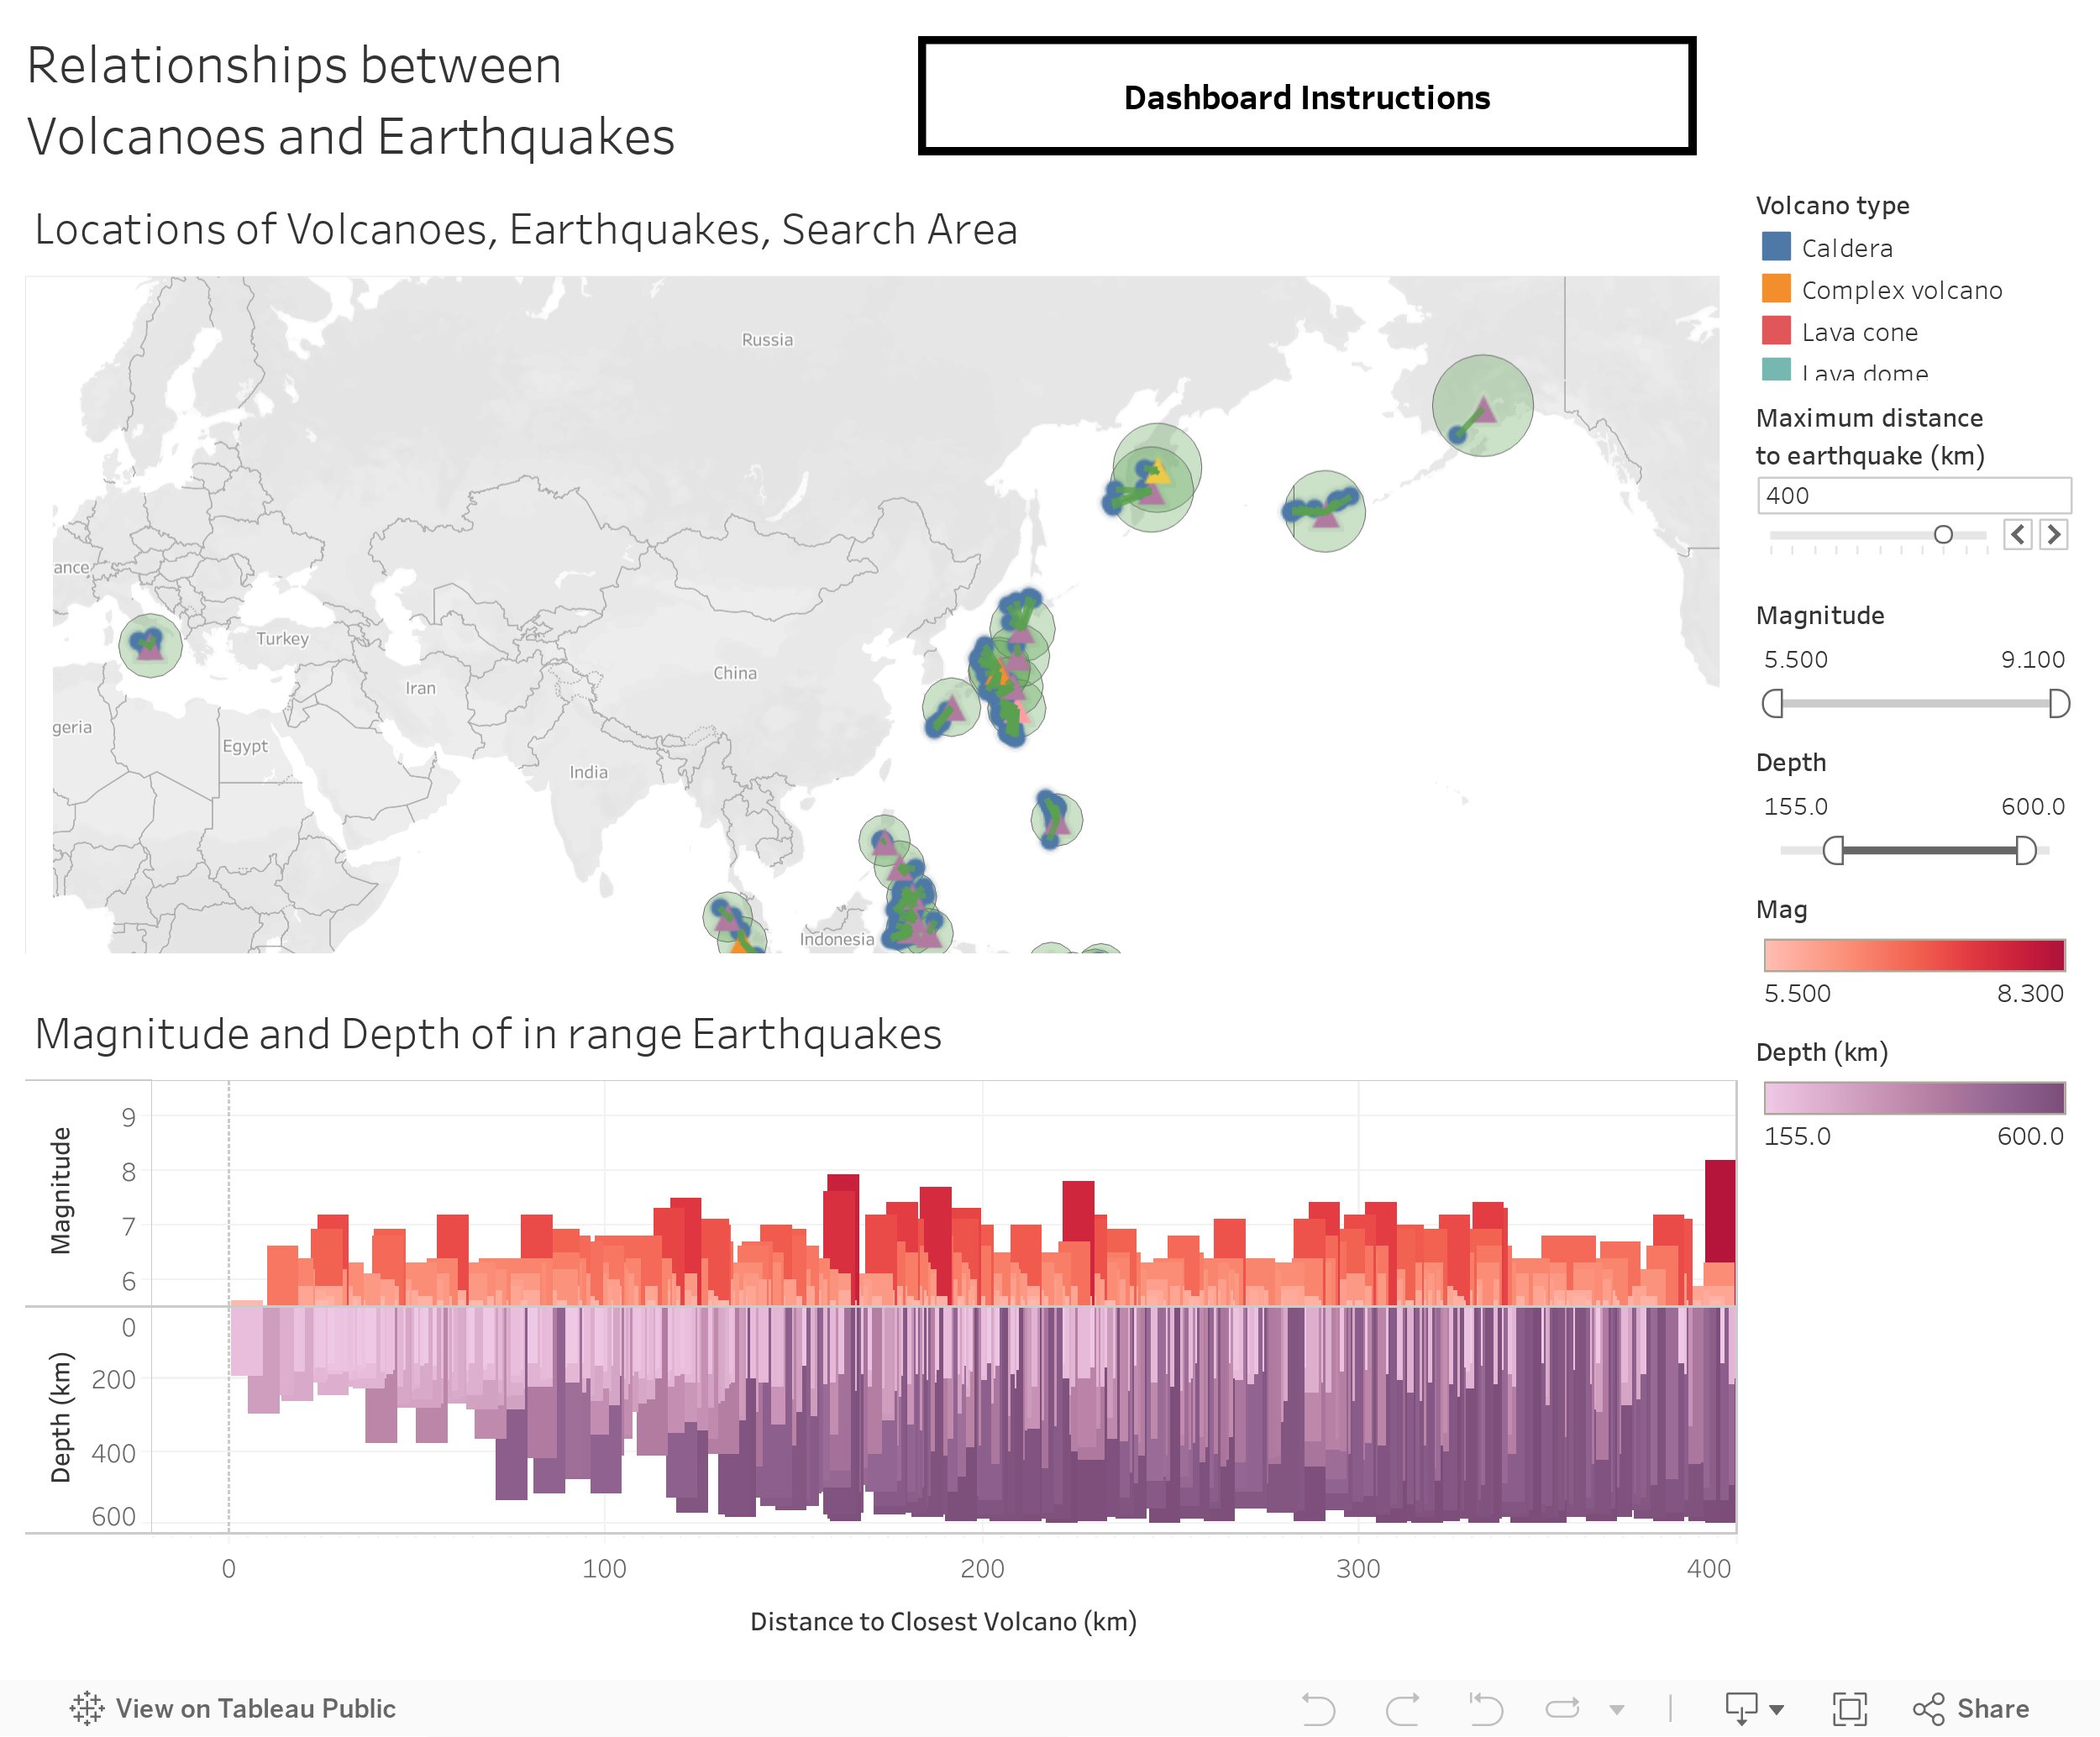
"What are the maginitudes and depths of earthquakes within a selected radius of a volcano?"
This is a great example of a dashboard the combines spatial calculations with data distributions limited by user inputs.
"What are the maginitudes and depths of earthquakes within a selected radius of a volcano?"
This is a great example of a dashboard the combines spatial calculations with data distributions limited by user inputs.
Claire Pickerel (Senior, Geology-Geology Concentration):
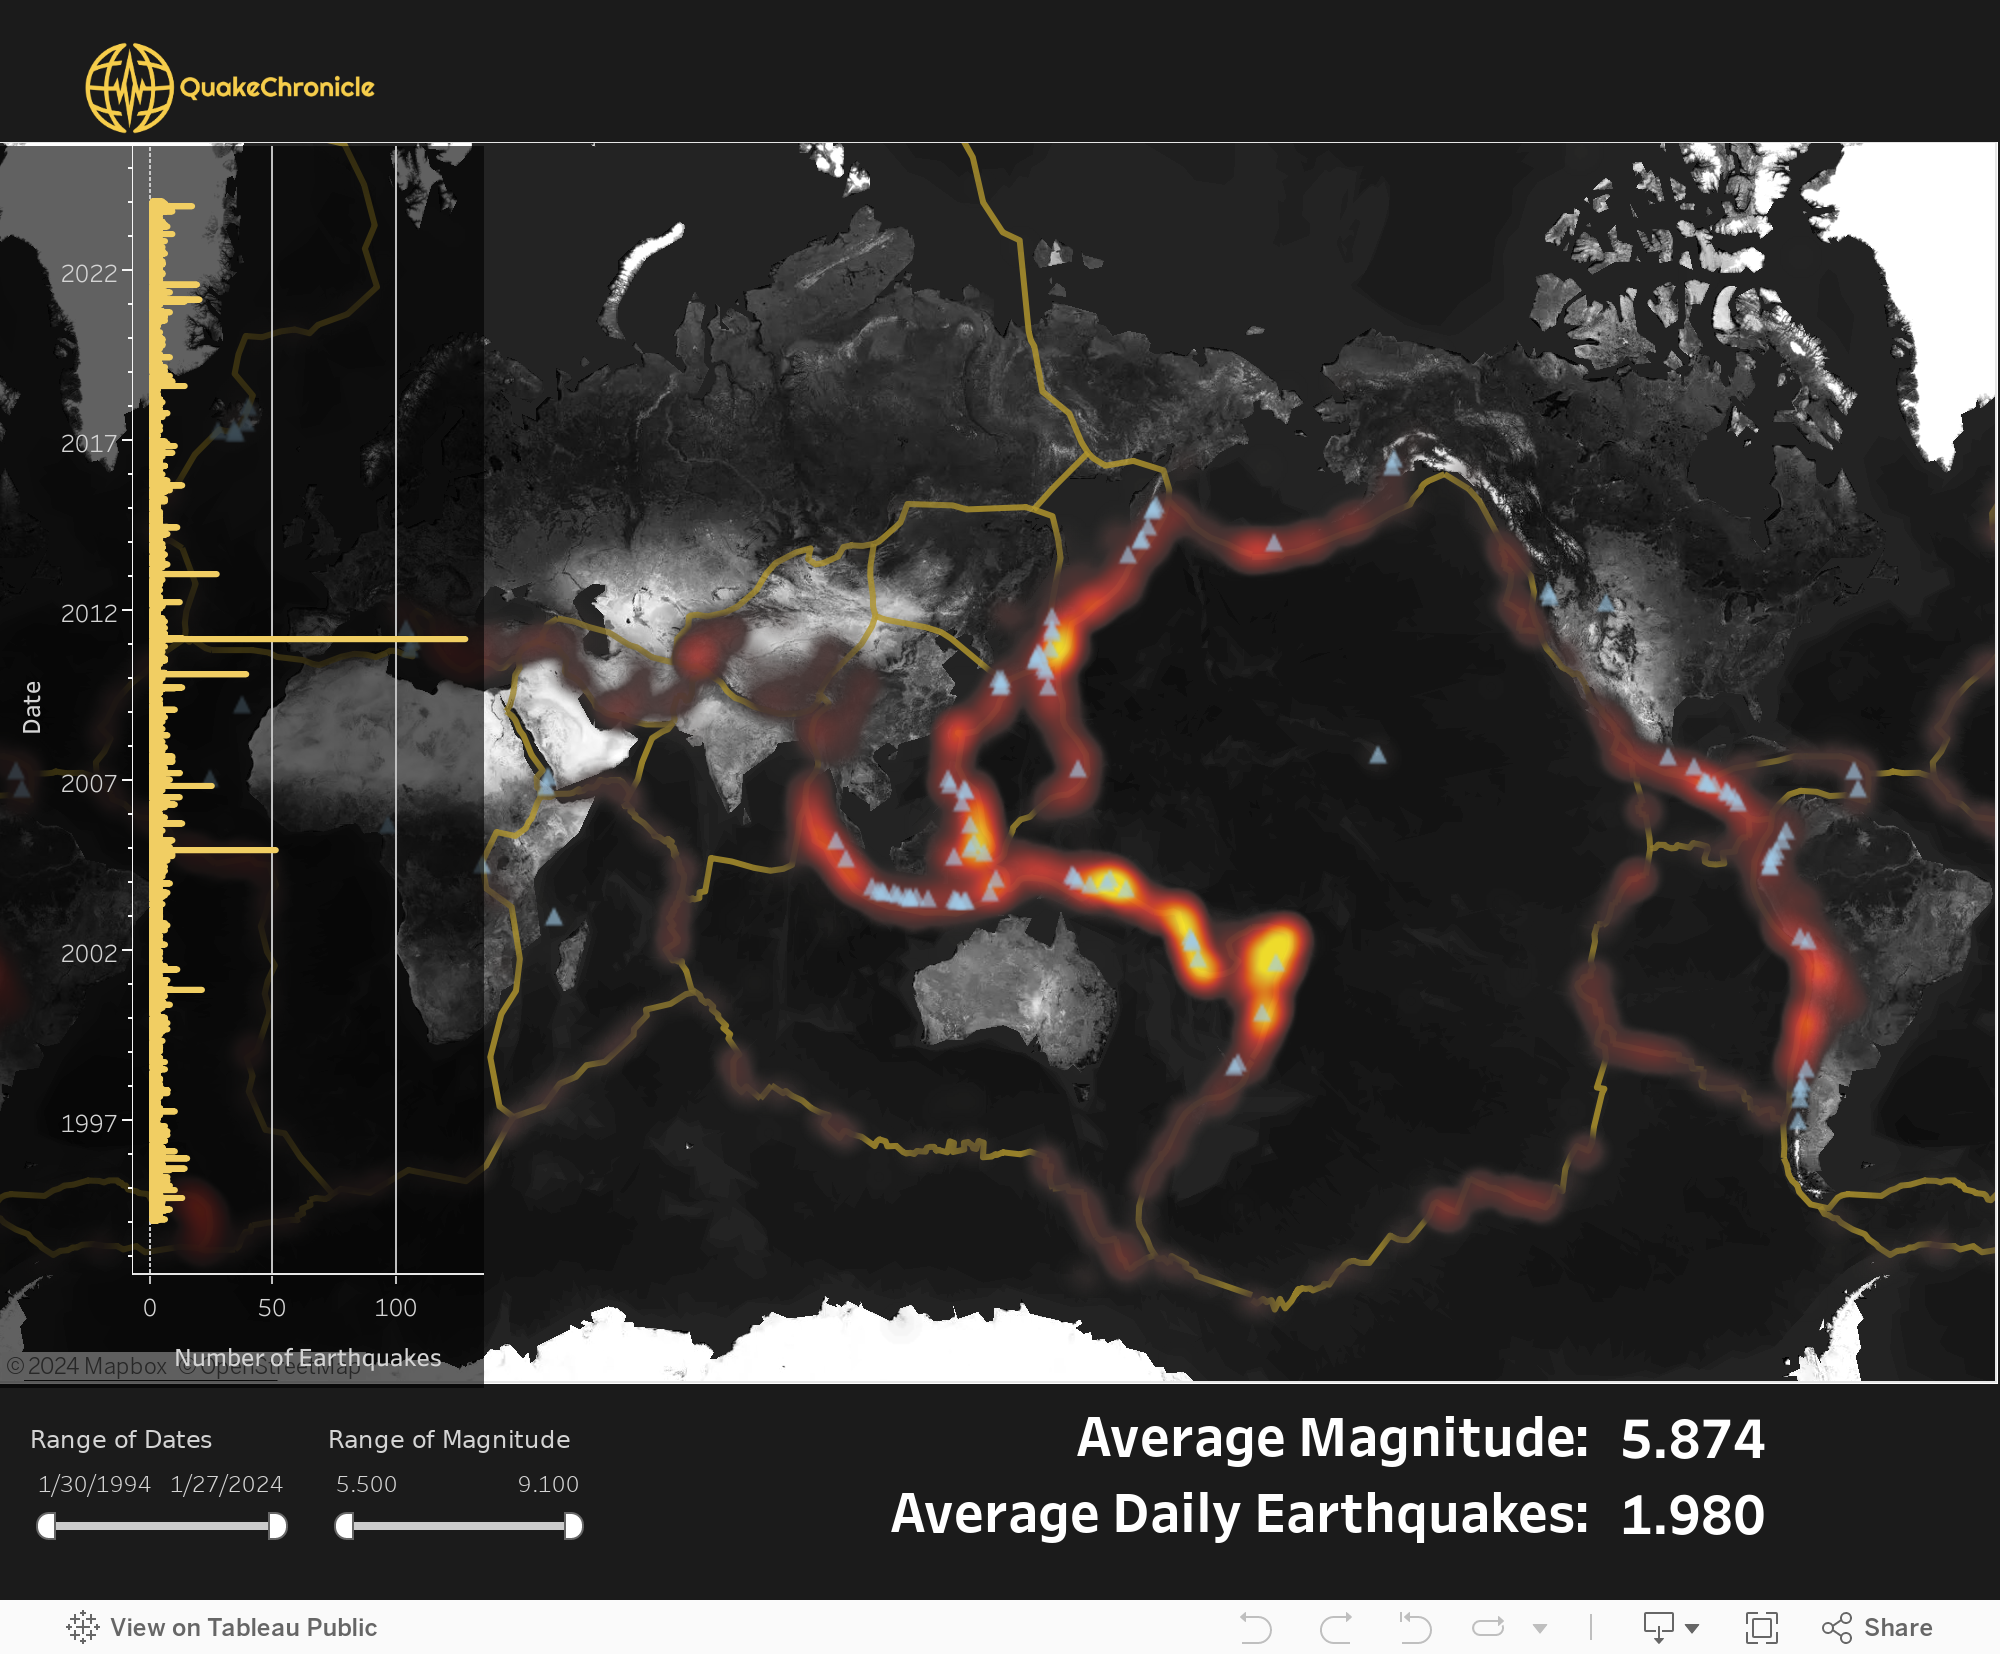
"Are there clusters of earthquakes that happen in a single day? If so, where do they occur and are there volanoes nearby?"
This example makes effective use of color and interactivity to explore volcanic hotspots.
"Are there clusters of earthquakes that happen in a single day? If so, where do they occur and are there volanoes nearby?"
This example makes effective use of color and interactivity to explore volcanic hotspots.
Josh Watzack (MS Geophysics):
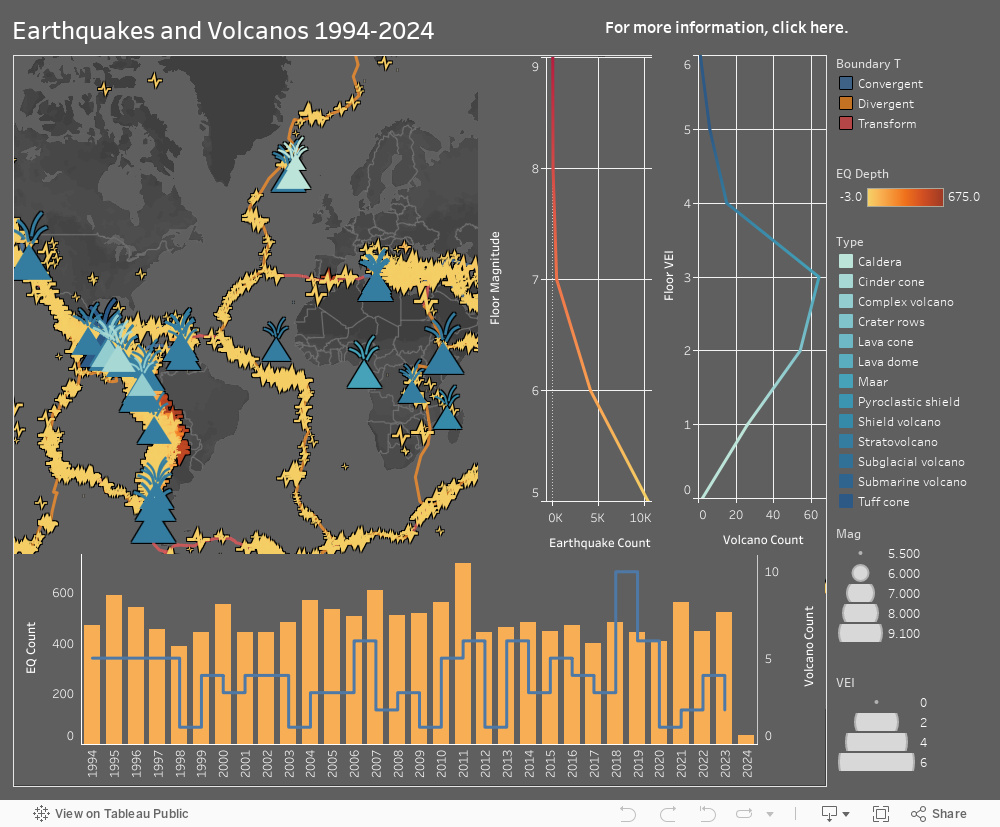
"Where do the earthquakes and volanoes occur and what are their attributes?"
This dashbaord creates an interactivity with the catchy, "Hover to Discover" phrase. Volcanoes are displayed based on type and earthquakes based on depth and magnitude.
"Where do the earthquakes and volanoes occur and what are their attributes?"
This dashbaord creates an interactivity with the catchy, "Hover to Discover" phrase. Volcanoes are displayed based on type and earthquakes based on depth and magnitude.
Kyros Kasner (Senior, Geology-Geophysics Concentration):
"Where do the earthquakes and volanoes occur?"
"Where do the earthquakes and volanoes occur?"
Are you interested in learning to build a dashboard and visualize your data or class project?
Here are a few references to get you started:
- Check out some example dashboards on Tableau Public
- Download Tableau Public Desktop
- Watch the How-To Videos on Tableau Public